The load generator automatically creates a new execution record
whenever you launch a new test.
Execution is a storage container for a single performance test run
and associated data like browser cloud information,
transactions, networking activity from browsers, etc.
The project details page displays a list of executions
launched as a part of such a project.
All such executions are sorted according to launch timestamp,
the most recent at the top, so you have faster access
to the most recent data.
We are dividing a list of executions into pages
once you have more than 10 executions within a given project,
so please use pagination buttons to navigate the list.
Additionally, feel free to use a search box
for faster access to executions you are interested in.
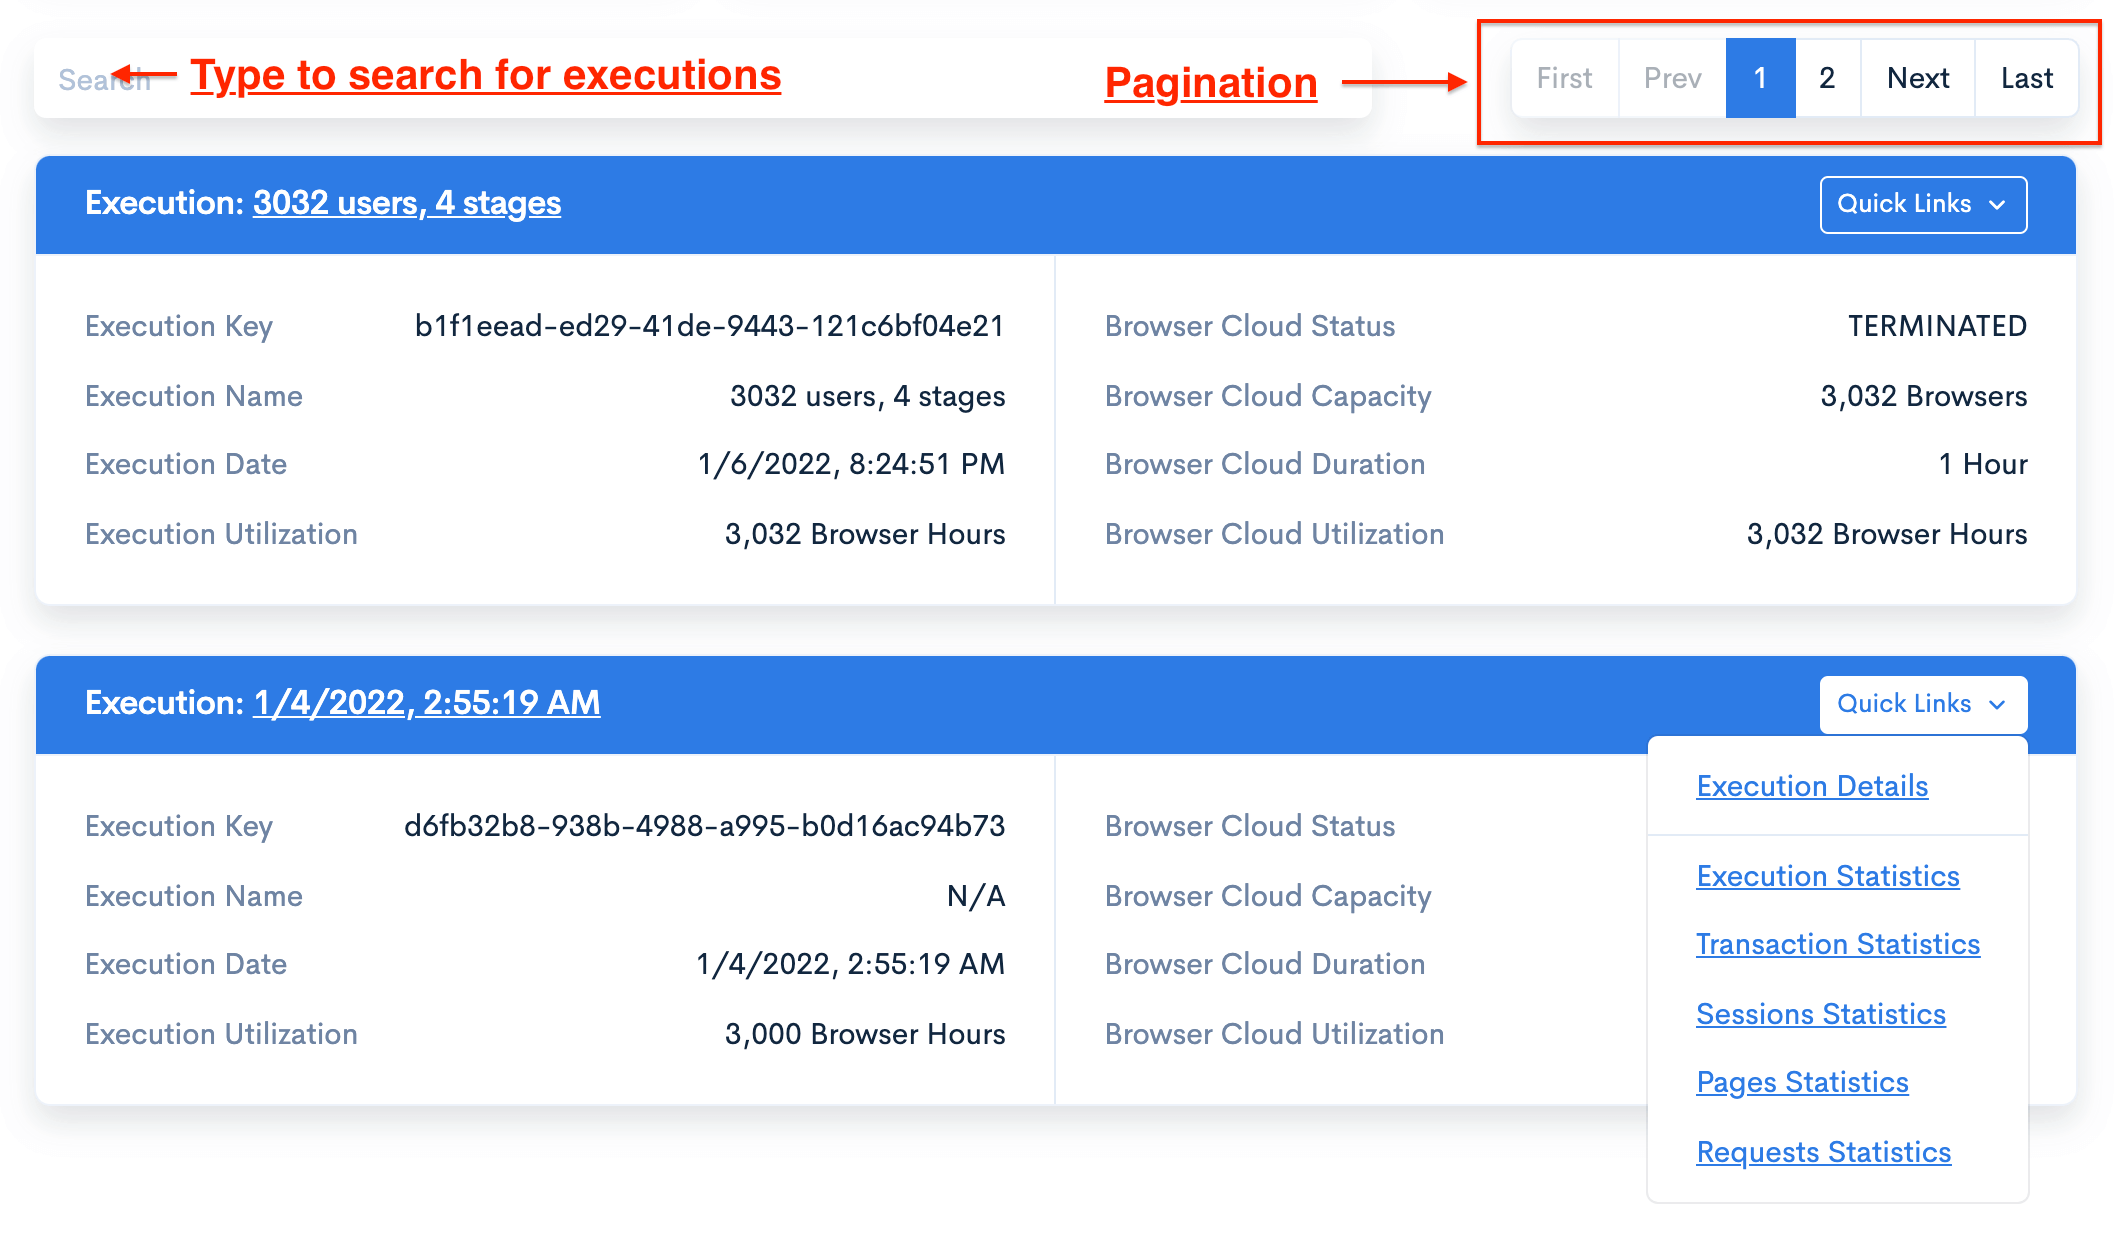
Every execution card on a project details page has a "Quick Links" dropdown,
so you can quickly jump to different statistical views of the performance test results.
When you get to the "Execution Details" page, you can see the main characteristics of the execution:
- Execution name, date, utilization, and notes
- Details of the browser cloud(s)
- Quick links to view statistical data
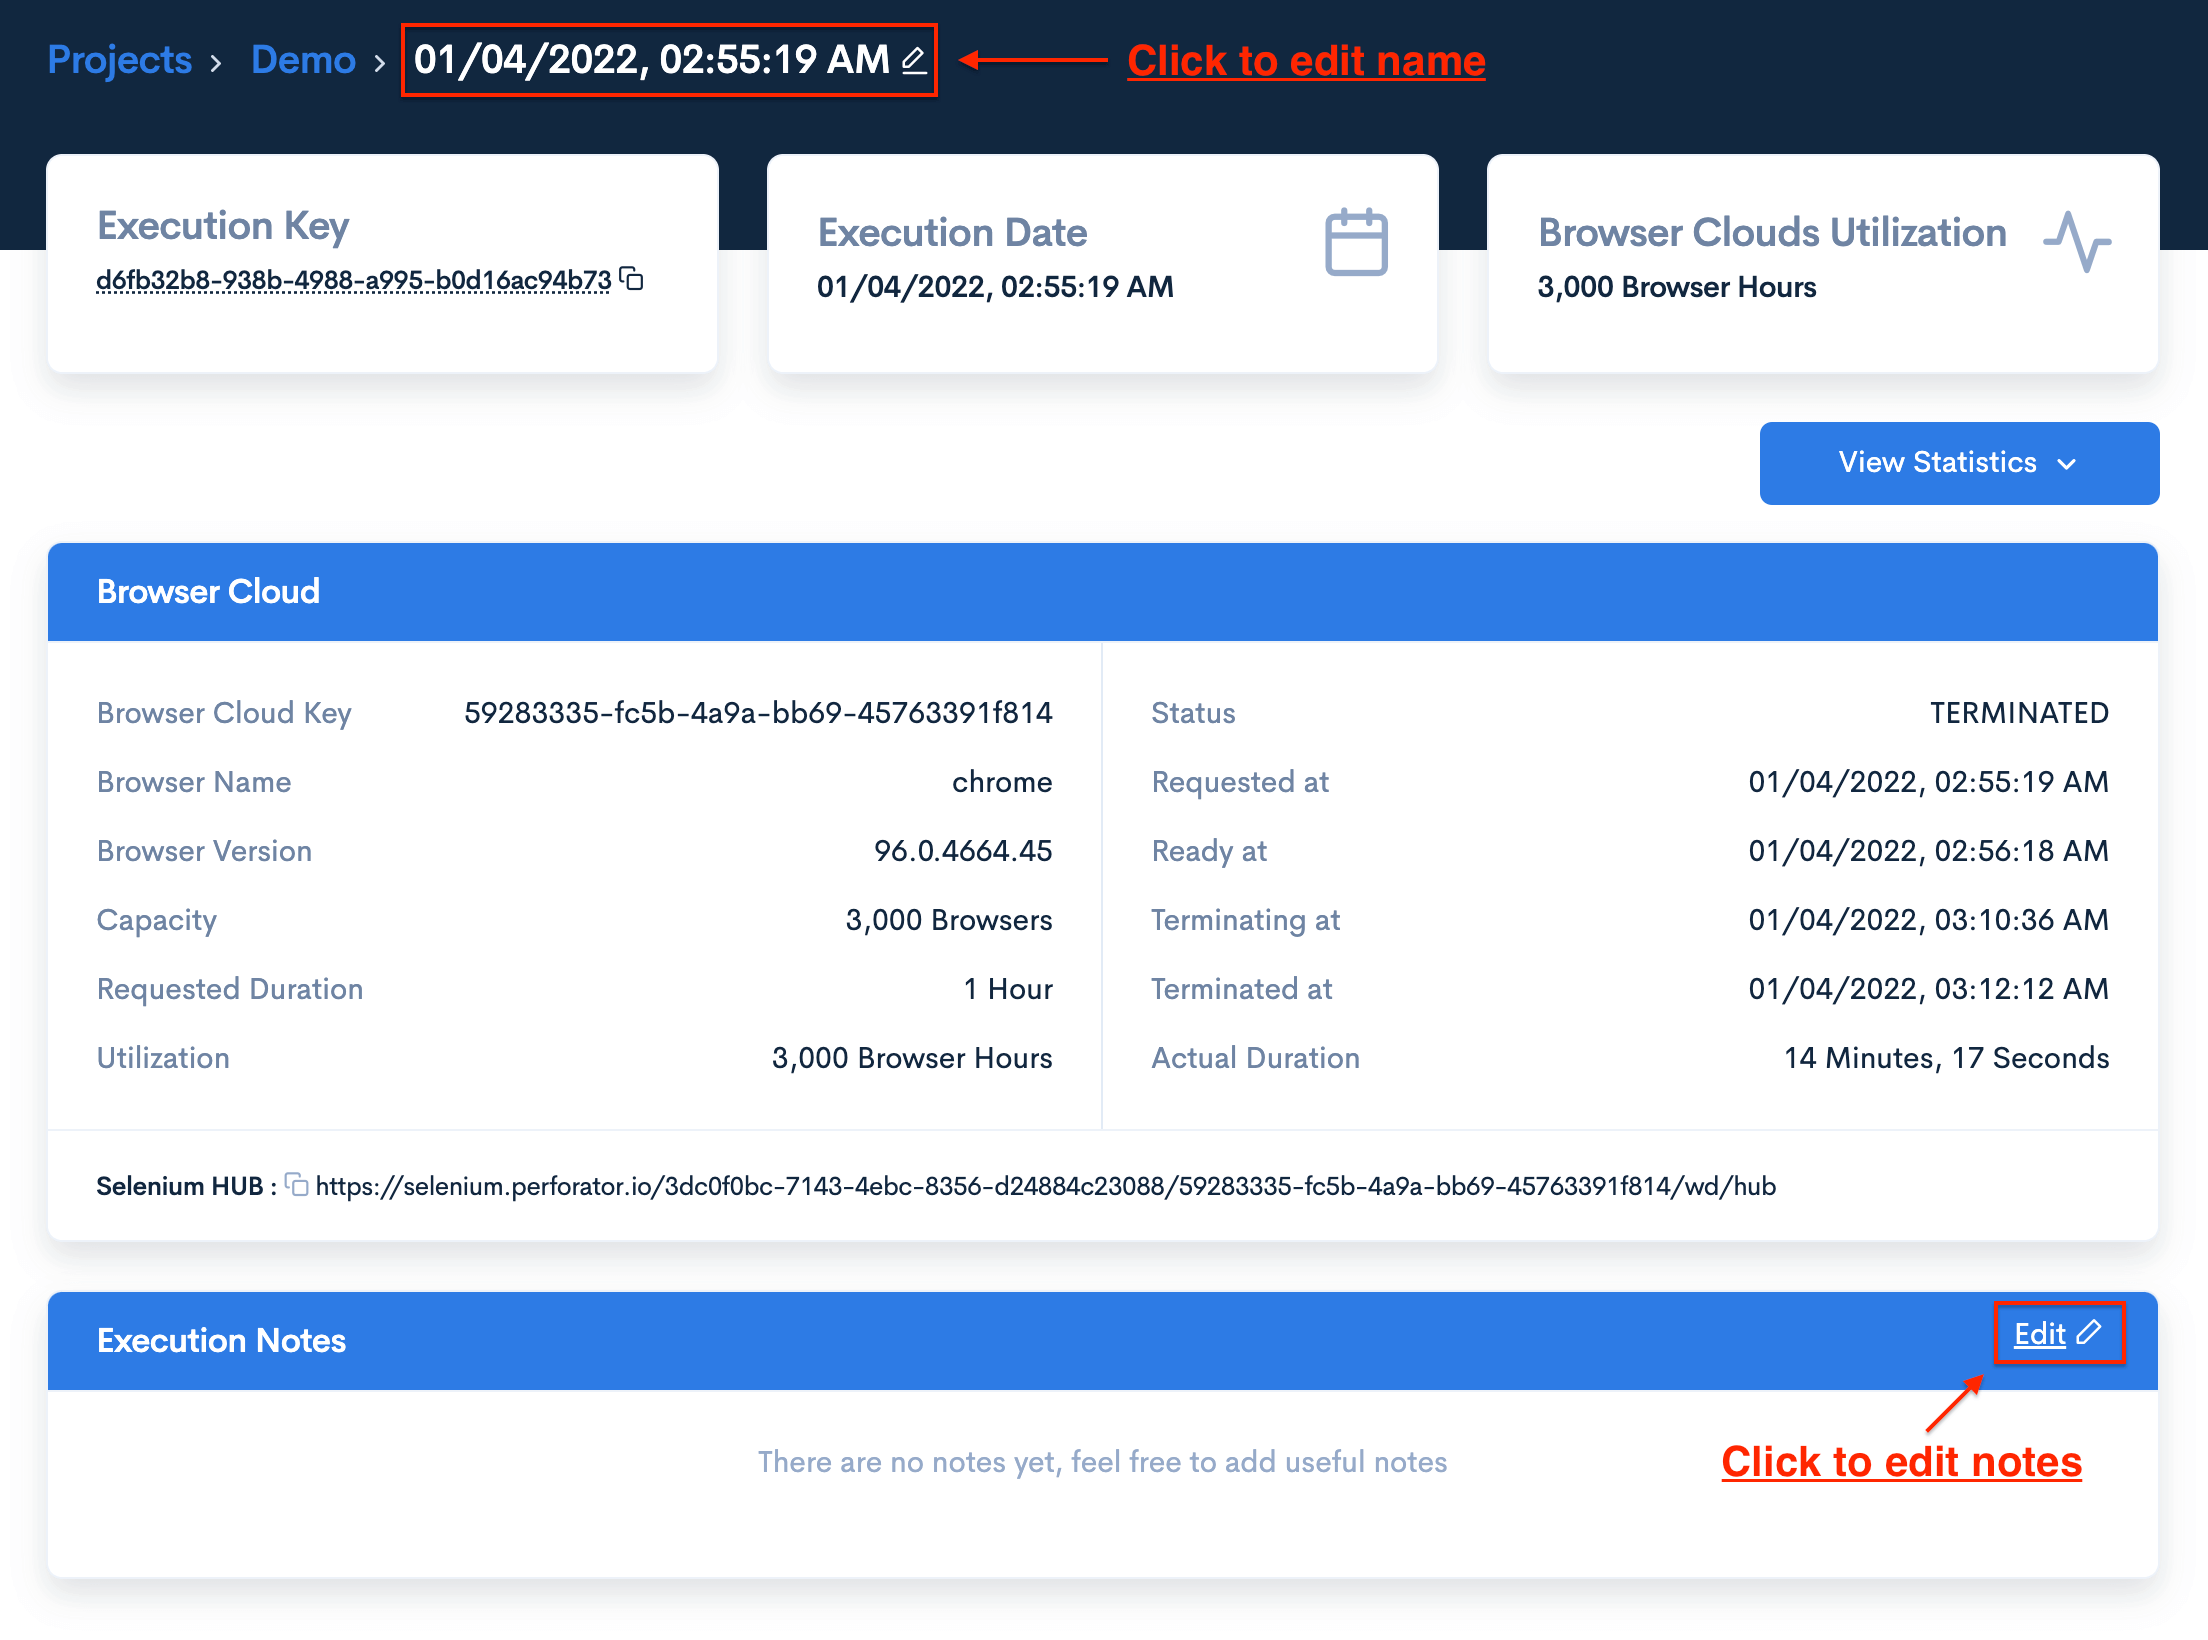
While execution name and notes are optional, you can still
edit it - such information might be helpful long-term
when you need to remember details of the execution.
Note: By default, the execution record doesn't have any name.
For easier access, it is displayed as a timestamp of the performance test launch,
formatted according to the local timezone of your browser.